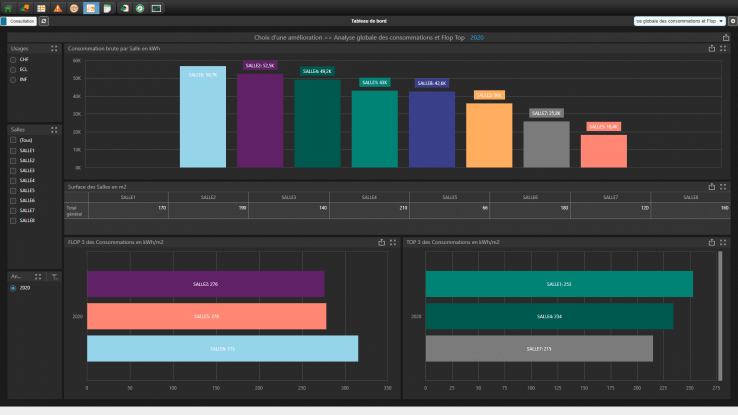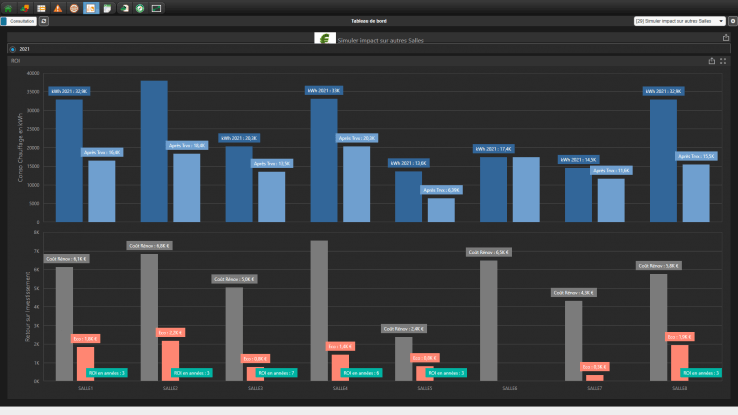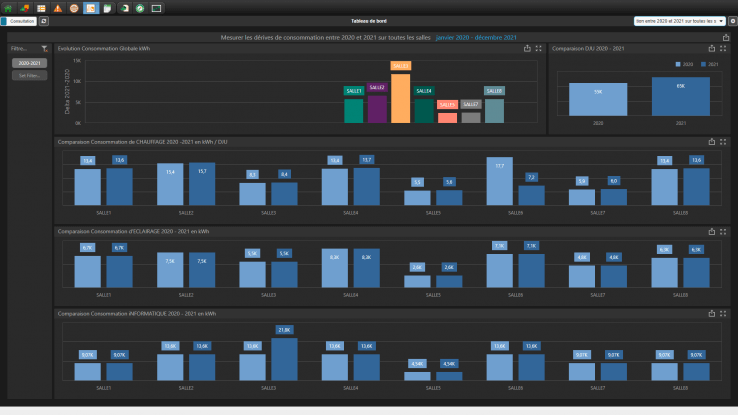
The volume and diversity of the raw data generated by a BMS often makes it unusable in its current state. For a 5,000 m2 mixed-use building, AREAL's experts estimate that a BMS generates up to 3 million pieces of information per day, i.e. over 200,000 per year/m2. Having a data processing and analysis tool integrated into the BMS, intended for owners and operators, allows for a qualified and in-depth energy study that facilitates decision-making and forward planning for deviations.
Topkapi's Dataviz module for data analysis
Topkapi's Dataviz module calculates the performance indicators and graphically formats the results for viewing and exploration.
Drawing on a powerful calculation engine enabling the raw data to be aggregated, it presents the indicators in the form of dashboards. These veritable decision-making interfaces facilitate proactive management. They measure performance in order to assess the ground covered and still to be covered in order to achieve the goals and present objective evidence to judge the situation. Topkapi's Dataviz module also enables decision-makers to identify performance deviations as quickly as possible and take corrective action. Lastly, it can be a tool for internal communication and raising awareness of good behaviour.
An essential component of a BMS for energy efficiency
One of the main avenues in the analysis of building data is to identify equipment that is not performing optimally in relation to its actual use. To do so, it is necessary to be able to put into perspective:
- consumption,
- intensity of use,
- seasonal variations,
- benchmarks,
And process everything for each month of the year or even each day of the week. Using this type of analysis, energy improvements can be targeted for the fastest ROI.
Data analysis is a major challenge to serve the building industry's energy efficiency goals. To achieve this, having a module integrated into the BMS offers flexibility and ease of deployment. This is what the Dataviz module of the Topkapi monitoring software offers !
Warning : Define the appropriate indicators for each use
Detecting energy consumption anomalies requires consideration of the parameters that cause consumption to vary. This means that, to monitor heating consumption, the indicators to calculate are, for example:
-
the number of unoccupied heating hours
- the daily consumption in kWh per m2, per hour of occupancy and per UDD (the key indicator of climatic variations)
For IT hardware-related consumption, it is advisable to monitor kWh per workstation and per hour worked.
The aim is to limit deviations, whether due to a setting or planning error, a deterioration in the performance of equipment or user behaviour.


